Learn how to calculate the Average Annual Growth Rate (AAGR) in Excel. This is also sometimes referred to Average Annual Return. The Average Annual Growth Rate is a term that is used primarily in financial return documents, such as Mutual Funds.
Depending on your preferred investment firm, you may see returns as Average Annual Return instead of Compounded Annual Growth Rate. As an investor, be sure to ask your financial advisor to provide both the AAGR and CAGR. You will see in the example below that the AAGR can be extremely misleading based on how it is calculated. The most common way AAGR is reported is in 3yr, 5yr, and 10yr increments.
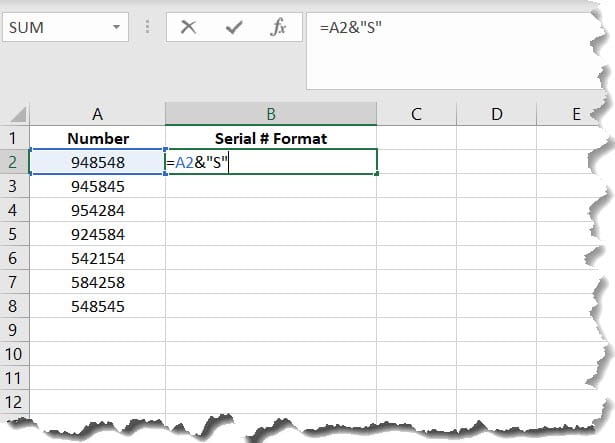
Average Annual Growth Rate (AAGR)
Let’s look at the following AAGR example. To begin, we need to find the Annaul Growth Rate for each year in our data set.
AGR = (Ending Value - Beginning Value) / Beginning Value
Next, in order to find the average, we use the AVERAGE Function based on the number of years. Our example is broken up into 3yr, 5yr, and 10 year increments.
3yr =AVERAGE(C6:C8)
5yr =AVERAGE(C6:C10)
10yr =AVERAGE(C6:C15)
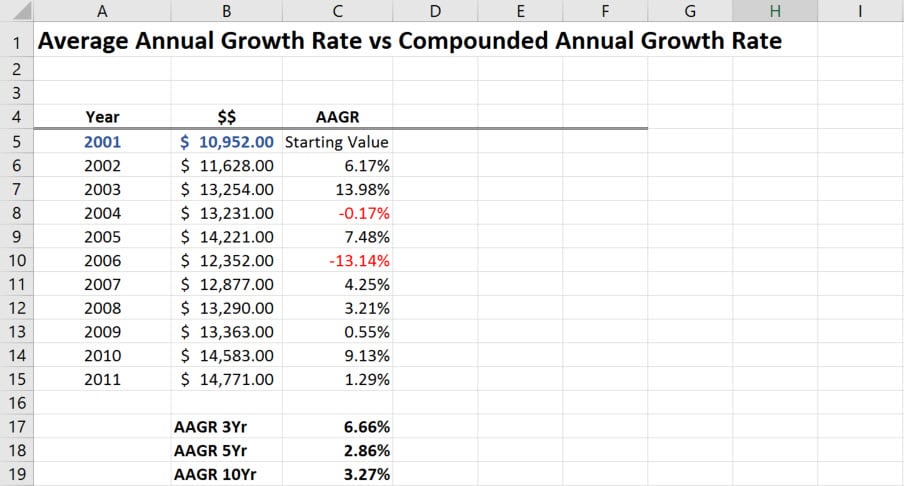
In our example, we posted a strong 3 year AAGR, but a not so strong 5yr and 10yr.
AAGR vs CAGR
Comparing our results to the Compound AGR, we see a slight different story.
As a reminder, CAGR is calculated by using the following formula. We are going to plug this formula into our table above.
=((End Value/Start Value)^(1/(Periods-1))-1
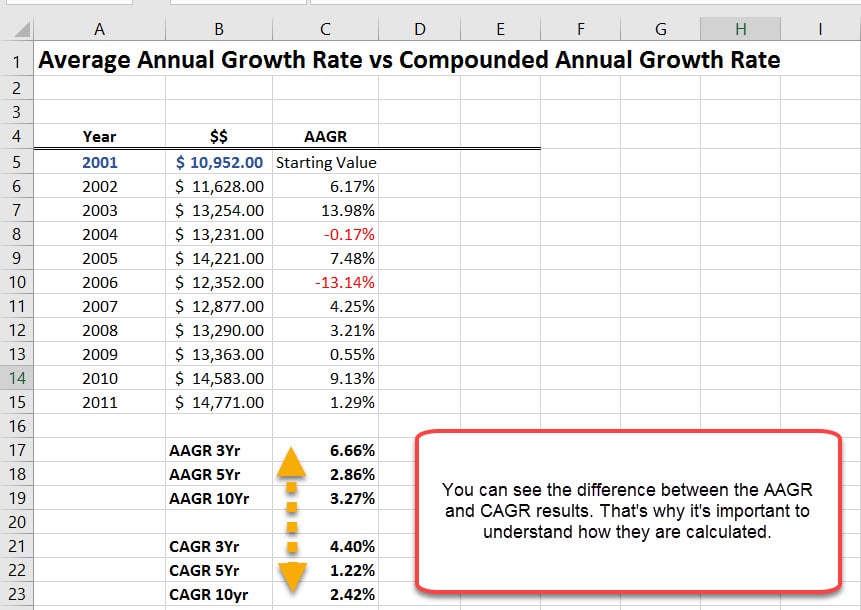
Looking at the results, you can clearly see that the AAGR calculation makes it appear the actual returns were better than they actually were. In my opinion, CAGR gives you a much better insight.