Learn the detailed history of Microsoft Excel.
Microsoft Excel is a spreadsheet software program developed by Microsoft Corporation. It was first released for the Macintosh in 1985 and for the Windows operating system in 1987. The program is a part of the Microsoft Office suite of productivity software and is widely used for data analysis, financial modeling, and business intelligence.
The first version of Excel, called Multiplan, was released in 1982 for the Macintosh, CP/M, and MS-DOS operating systems. It was a basic spreadsheet program that was not very popular. However, Microsoft continued to develop the program and released Excel 2.0 in 1987, which was the first version to run on the Windows operating system. This version of Excel included more advanced features such as graphing, macros, and the ability to handle large amounts of data.

Excel 3.0, released in 1990, was the first version to support the VBA (Visual Basic for Applications) programming language, which allowed users to create custom functions and macros. This version also included support for 3-D charts and a new look and feel. Excel 4.0, released in 1992, added support for the Windows 3.1 operating system and improved the program’s ability to work with large amounts of data.
Excel 5.0, released in 1993, was the first version to support the Windows 95 operating system and included new features such as the ability to create pivot tables and the ability to create and edit charts and graphs directly within the spreadsheet. Excel 95 also introduced the “IntelliSense” feature, which provided context-sensitive help and suggestions as the user typed formulas.
Excel 97, released in 1996, was a major update that included support for the Windows 95 and Windows NT operating systems. It also included new features such as “AutoComplete” which automatically completed formulas as the user typed them, and “AutoCalculate” which automatically recalculated formulas as data was entered. Excel also introduced the “Analysis ToolPak” which provided a set of advanced data analysis tools.
Excel 2000, released in 1999, was the first version to support the Windows 98 and Windows NT operating systems. It included new features such as “Smart Tags,” which provided context-sensitive help and suggestions as the user typed, and “DataPilot,” which allowed users to create pivot tables and charts more easily.
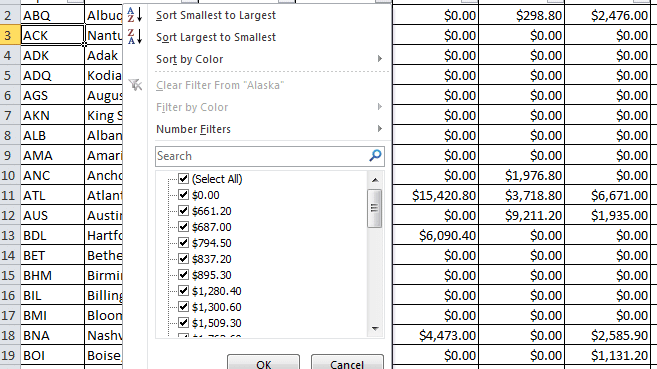
Excel 2002, released in 2001, was the first version to support the Windows XP operating system. It included new features such as “List,” which allowed users to create and manage lists of data, and “AutoFilter,” which allowed users to filter and sort data in a more efficient way.
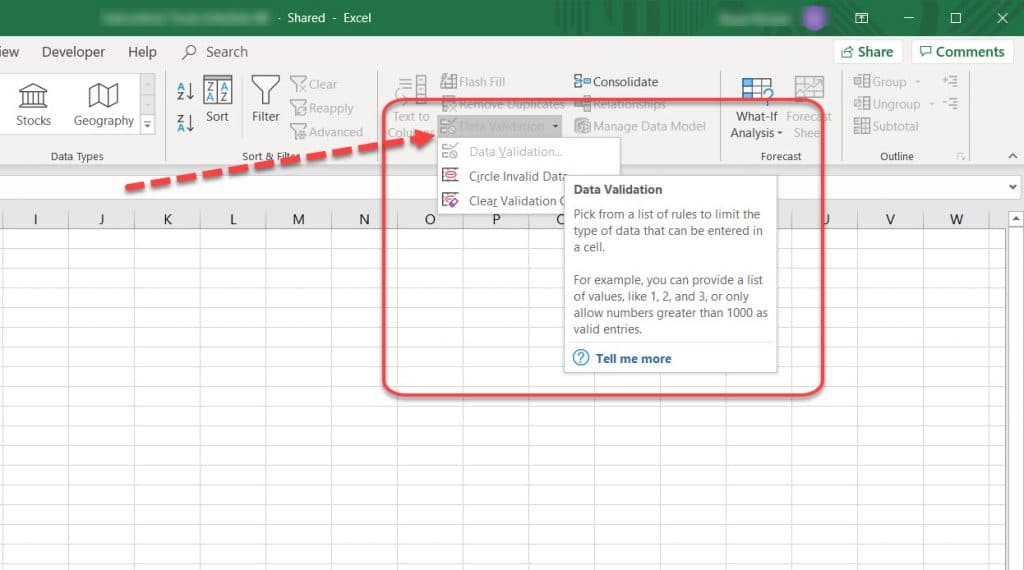
Excel 2003, released in 2002, was a major update that included new features such as “XML Data Import” which allowed users to import data in XML format, and “Data Validation” which allowed users to set data validation rules to ensure data integrity.
Excel 2007, released in 2006, was the first version to support the Windows Vista operating system and included a new “Ribbon” interface which made it easier to find and use Excel’s features. It also included new charting and data visualization features, improved support for working with large amounts of data, and new collaboration and sharing features.
Excel 2010, released in 2010, introduced new features such as “Sparklines” which allowed users to create small, in-cell charts to show trends in data, and “Slicers” which allowed users to filter data in pivot tables and pivot charts.
Excel 2013, released in 2013, introduced new features such as “Flash Fill” which automatically fills in data based on patterns, and “Quick Analysis” which provided a set of tools for data analysis.
Excel 2016, released in 2015, introduced new features such as “Power Query” which allowed users to easily connect to and import data from external sources, and “Power Pivot” which allowed users to create pivot tables and pivot charts with much larger data sets.
Excel 2019, released in 2018, introduced new features such as “Power BI” which integrated data visualization and business intelligence capabilities into Excel, and “Natural Language Formulas” which allowed users to create formulas using plain language.
Excel for Microsoft 365, which was released in 2020, added new features such as “Ideas” which provided suggestions for data analysis and visualization, “Data Types” which allowed users to define the type of data in a column, and “Dynamic Array Formulas” which allowed users to create formulas that automatically adjust to the size of the data.
In 2021, Microsoft has announced a new version of Excel which is Excel for the web, which is a web-based version of Excel that allows users to access and edit their Excel files from any device with an internet connection. The new version also includes new features such as “Data Types” which allows users to define the type of data in a column and “Dynamic Array Formulas” which allows users to create formulas that automatically adjust to the size of the data.
As of 2023, Microsoft continues to improve and update Excel with new features and capabilities. With the rise of data analysis, machine learning and automation, excel has become an essential tool for businesses and organizations of all sizes to manage, analyze and make sense of their data. With its powerful capabilities and easy-to-use interface, Excel remains one of the most popular and widely used spreadsheet software programs in the world.