Learning Tableau for Data Visualization
Tableau is a data visualization tool used in business and academics. This software allows you to analyze data with its powerful graphs and charts. Quite simply, it is the best software for developing business insights and evaluating business models.
Tableau can be used for a number of reasons in large and small business enterprises. The primary usage is to analyze how sales are affected by seasons, demography and discount offers.
At Excelbuddy.com, we will help you to learn various data analysis techniques by providing real world examples. We will try to keep each tutorial as simple as possible without any requirement of programming or advanced level statistical knowledge.
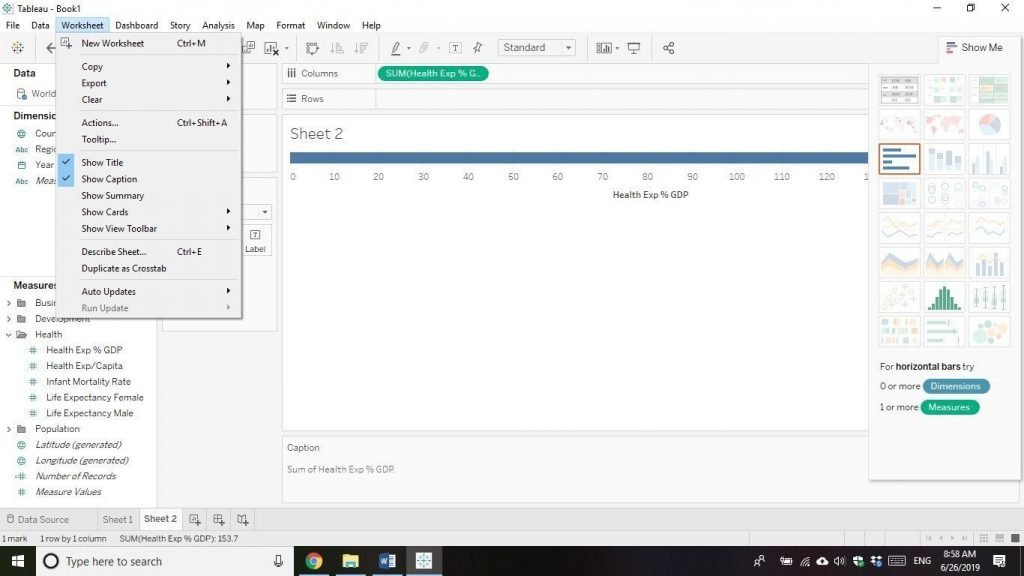
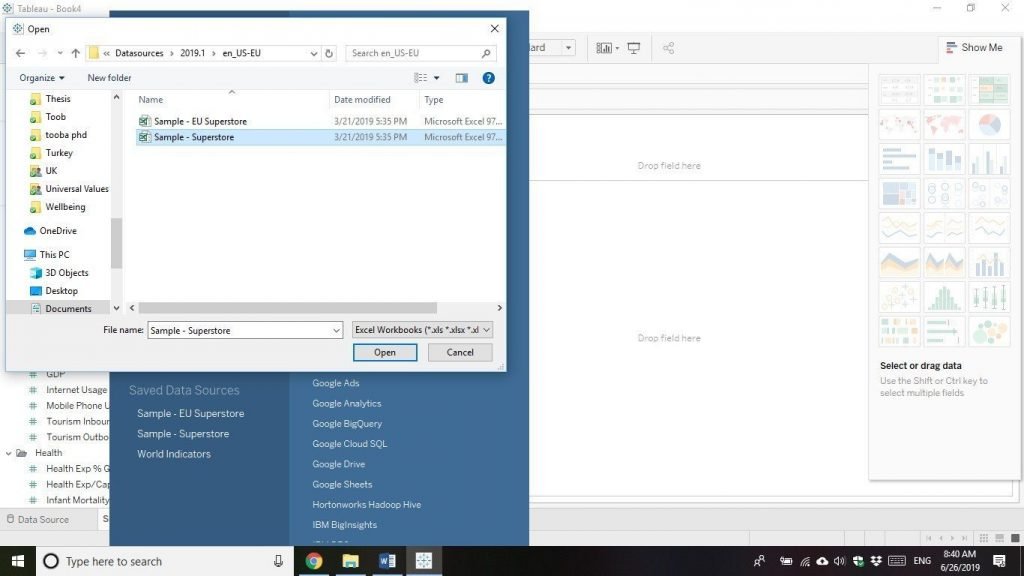
Let’s start learning Tableau from loading data into the software.