
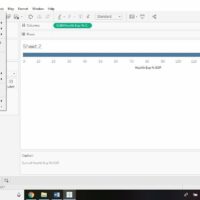
Tableau Interface Review
Tableau helps you analyse data and start storytelling through data visualization. To know more about how it works, let’s start learning about the interface of Tableau. This will […]
Tableau Interface Review Read More »
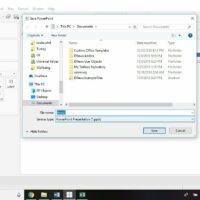
Tableau helps you analyse data and start storytelling through data visualization. To know more about how it works, let’s start learning about the interface of Tableau. This will […]
Tableau Interface Review Read More »
Let’s take an example by importing data. Goto> Data> Microsoft Excel gives the location of the file, for example. C:\Users\Dell\Documents\My Tableau Repository\Datasources\2019.1\en_US-EU And select the system file Sample
Import/Export Data in Tableau Read More »
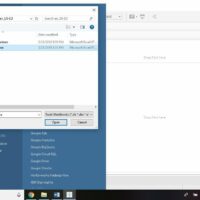
There are many ways in which you can load data into Tableau. The easiest and most familiar way could be loading data from excel. You may also load

Learning Tableau for Data Visualization Tableau is a data visualization tool used in business and academics. This software allows you to analyze data with its powerful graphs and
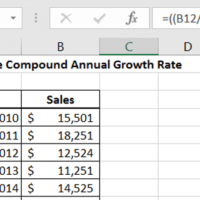
The compound annual growth rate (CAGR) is an essential function regardless of industry. In this tutorial, we will cover how easy it is in Excel to formulate this
Compound Annual Growth Rate (CAGR) Read More »
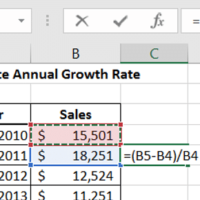
Annual Growth Rate in Excel Calculating the Annual Growth Rate in Excel is very easy. Annual growth rates are used across all industries to determine business trends both
Annual Growth Rate in Excel Read More »